Online engagement reports: more participation means more data
The web is a great place for public engagement. But analyzing the growing amounts of data resulting from the increases in participation is discouraging some practitioners. Here’s how they can fight back.
To truly understand, one must listen. To truly listen one must find ways to maintain an ongoing, open dialogue with those one seeks to understand. One must get close to their lives, their daily struggles, frustrations and the conditions that create them. It is only after one develops this empathy that one can modify one’s behaviours with the purpose of making a real difference.
Honest dialogue requires transparency. It requires that both parties experience the realization that the other party has a sincere intention to understand and if possible, to help make things better for them. Without transparency, it is naïve to believe that the thoughts being exchanged are truthful and complete.
The internet has an incredible potential to bring people together in open dialogue. This isn’t new. Online communities have been around for a long time. Long before today’s social networks existed, people communicated with each other using bulletin board systems (BBS), mailing lists, forums and chatrooms. People used these tools to look for jobs, help each other solve problems and even find a mate. As soon as computers became connected, the humans using them sought to connect with one another.
With more and more organizations using the internet to widen public participation, the opportunities for society to come together and influence the conditions for its wellbeing are becoming more tangible.
More participation means more data
While organizations benefit from higher participation thanks to online engagement, they face the growing challenge of extracting and analyzing an ever-increasing amount of participation data. The challenge only gets worse as sources of input multiply. How can organizations collect, merge and analyze data stored across a multitude of databases, spreadsheets, documents, and even poster boards used during in-person events? And even after the data has been digitized and normalized, how can analysts visualize the data in ways that provide answers to important questions?
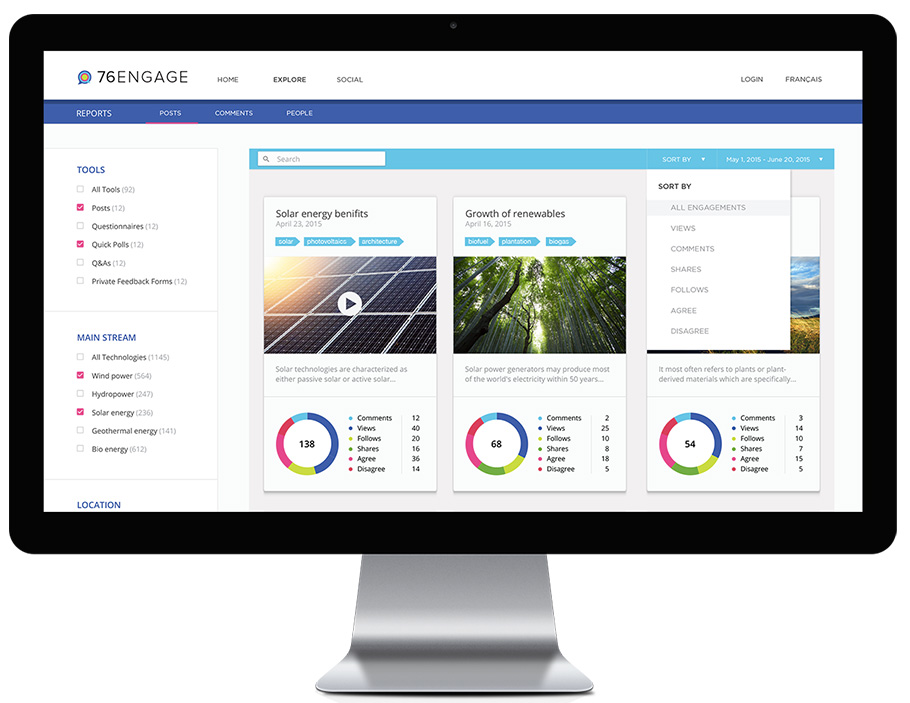
When we first imagined 76engage, we wanted to make it easy not only for participants to provide input but also for analysts to be able to generate reports and answer meaningful questions. As a centralized place where participants return again and again to provide input with every new engagement opportunity, participation data starts to accumulate fast. That’s why we spend a lot of time building reporting functions to make it easier for analysts and administrators to access the data they need.
Measuring attention and engagement
76engage provides a reporting dashboard that enables administrators to query, filter and visualize all kinds of participation data. These reports provide summary statistics, participation per engagement and over time, visualizations of participation by geographic region using interactive maps, and actual input submitted by participants. Administrators can create custom reports, save the parameters and re-run them again later. Report outputs are accessible on-screen or downloadable as CSV data files. Administrators can also download participant input in narrative form, making it easy for them to distribute reports to management and throughout the organization.
When it comes to measuring attention, 76engage integrates with Google Analytics to help analysts discover the most popular content and how much time participants spend on the site. Google Analytics also helps marketing and communication teams identify top sources of traffic, enabling them to focus efforts and ad spend on channels that contribute to meaningful engagement. 76engage also integrates with 76insights, a tool that helps analysts understand which are the social media posts across social networks that provoke the highest number of reactions.
We would love to show you how 76engage is helping organizations conduct online engagement and get the data to answer the questions that matter most. Get in touch for a live demo.
Leave a reply